Q&A 9 How do you visualize alpha diversity (richness) across groups?
9.1 Explanation
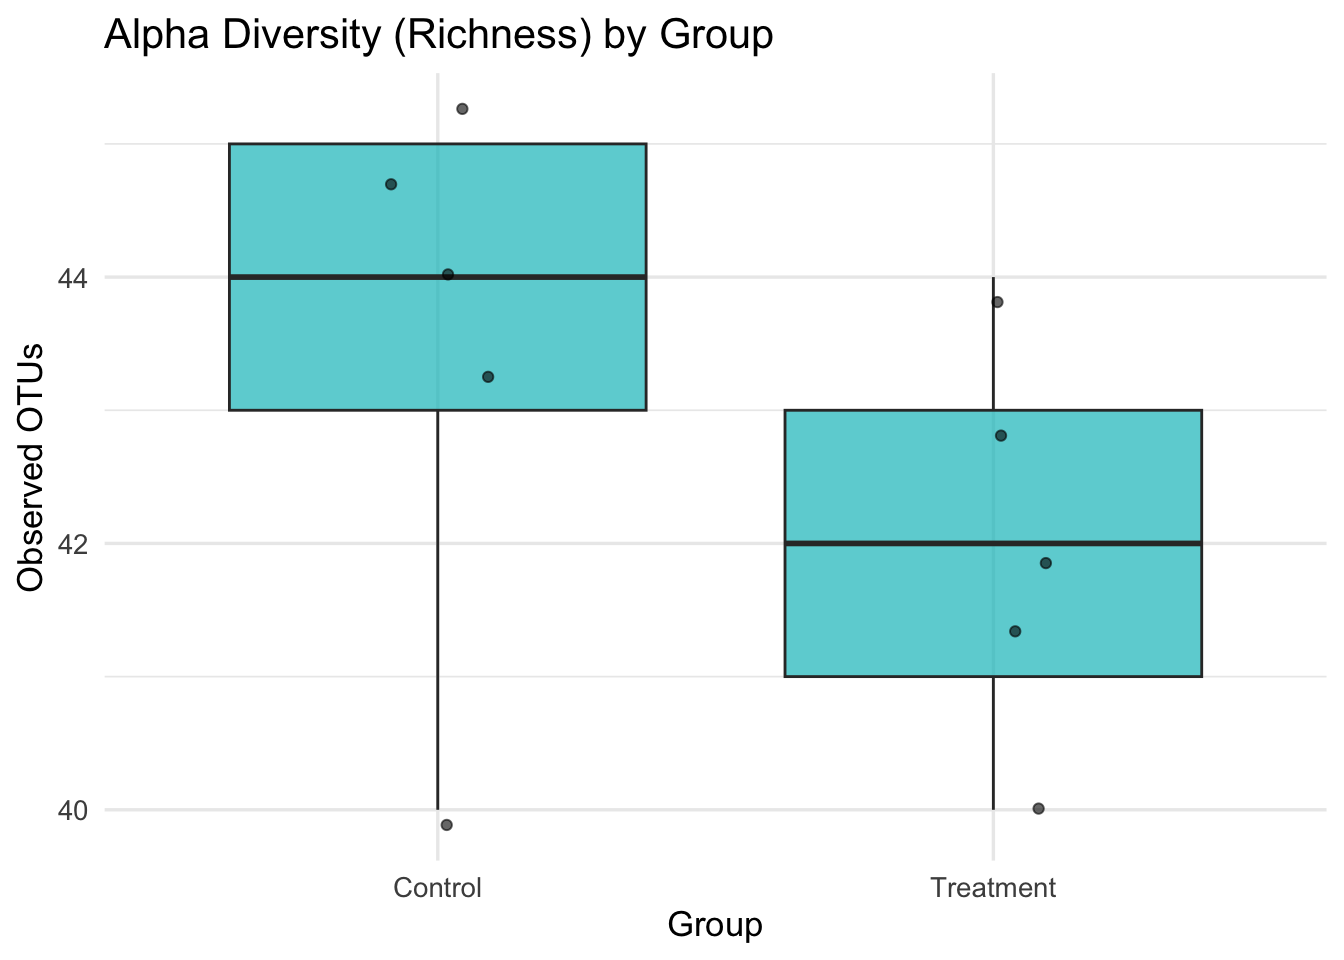
Alpha diversity measures within-sample diversity — often captured by the number of observed OTUs or ASVs (richness).
Visualizing alpha diversity across experimental groups (e.g., Control vs Treatment) helps detect differences in microbial complexity. Boxplots are commonly used for this purpose.
To generate the plot, we: - Sum OTUs per sample - Merge with metadata - Group by condition (e.g., Treatment group)
9.2 Python Code
import pandas as pd
import seaborn as sns
import matplotlib.pyplot as plt

# Load OTU table and metadata
otu_df = pd.read_csv("data/otu_table_filtered.tsv", sep="\t", index_col=0)
meta_df = pd.read_csv("data/sample_metadata.tsv", sep="\t")

# Compute richness
richness = pd.DataFrame({
    "sample_id": otu_df.columns,
    "richness": (otu_df > 0).sum(axis=0).values
})

# Merge with metadata
merged = pd.merge(richness, meta_df, on="sample_id")

# Plot
plt.figure(figsize=(8, 5))
sns.boxplot(data=merged, x="group", y="richness", palette="Set2")
sns.stripplot(data=merged, x="group", y="richness", color='black', alpha=0.5)
plt.title("Alpha Diversity (Richness) by Group")
plt.ylabel("Observed OTUs")
plt.xlabel("Group")
plt.tight_layout()
plt.show()
9.3 R Code
library(tidyverse)

otu_df <- read.delim("data/otu_table_filtered.tsv", row.names = 1)
meta_df <- read.delim("data/sample_metadata.tsv")

# Compute richness
richness <- colSums(otu_df > 0)
richness_df <- data.frame(sample_id = names(richness), richness = richness)

# Merge with metadata
merged <- left_join(richness_df, meta_df, by = "sample_id")

# Plot
ggplot(merged, aes(x = group, y = richness)) +
  geom_boxplot(fill = "#00BFC4", alpha = 0.7) +
  geom_jitter(width = 0.1, color = "black", alpha = 0.6) +
  theme_minimal(base_size = 13) +
  labs(title = "Alpha Diversity (Richness) by Group", y = "Observed OTUs", x = "Group")